Referenced Setup
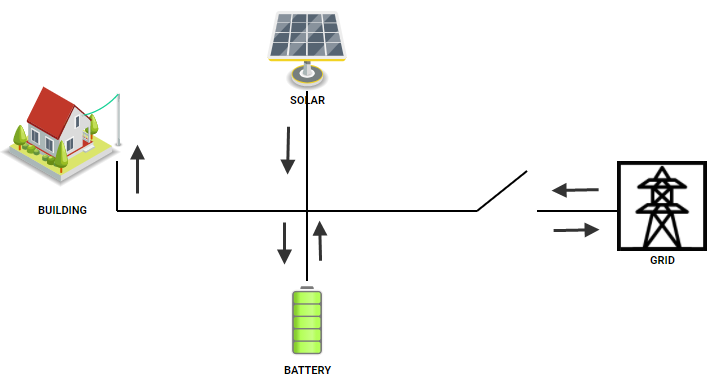
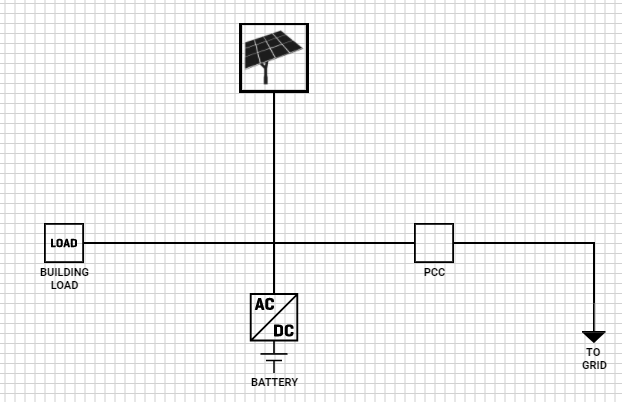
A single-line diagram, also sometimes called one-line diagram, gives you an overview or part of an electrical power system. In this section, you'll learn how to use OpenFMB HMI tool to build a single-line diagram that represents a very simple microgrid.
In this section, you will be setting up the single-line diagram based on the Referenced Setup.
To Build the Diagram
First, add the four pieces of equipment that we identified above. On OpenFMB HMI side navigator menu, click on Settings, then click on Devices
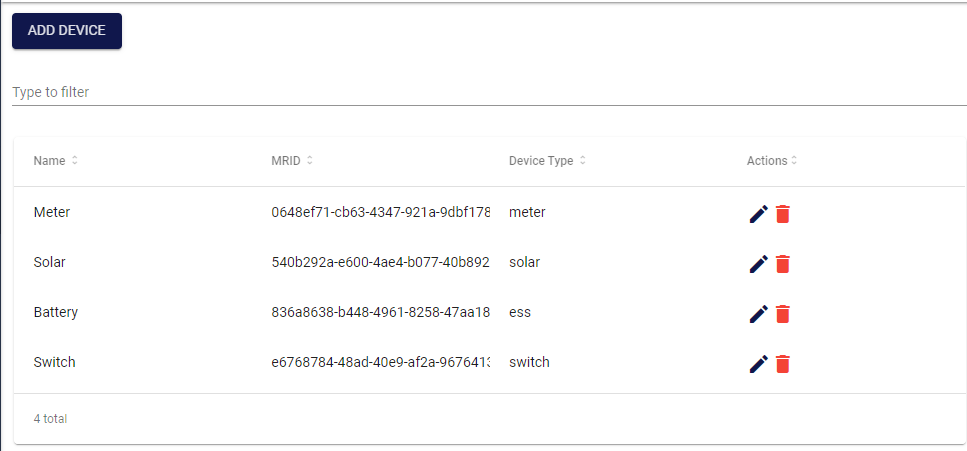
For each piece of equipment, click on "ADD DEVICE" to bring up the add device dialog and enter the following information
- Building load (using Meter as measurement equipment)
- Name: Meter
- Device Type: meter
- MRID:
0648ef71-cb63-4347-921a-9dbf178da687
- Solar PV:
- Name: Solar
- Device Type: solar
- MRID:
540b292a-e600-4ae4-b077-40b892ae6970
- Battery energy storage:
- Name: Battery
- Device Type: ess
- MRID:
836a8638-b448-4961-8258-47aa18e05f65
- Switch at PCC:
- Name: Switch
- Device Type: switch
- MRID:
e6768784-48ad-40e9-af2a-9676413d4d6a
The device list will look as follows:
- Building load (using Meter as measurement equipment)
On OpenFMB HMI home page, click on "Diagrams".
Click on "ADD DIAGRAM" and fill out diagram's name, description, and location.
Click "SAVE" to save,
In the Action column of the newly created diagram, click the "Design" icon to bring up design canvas for the diagram
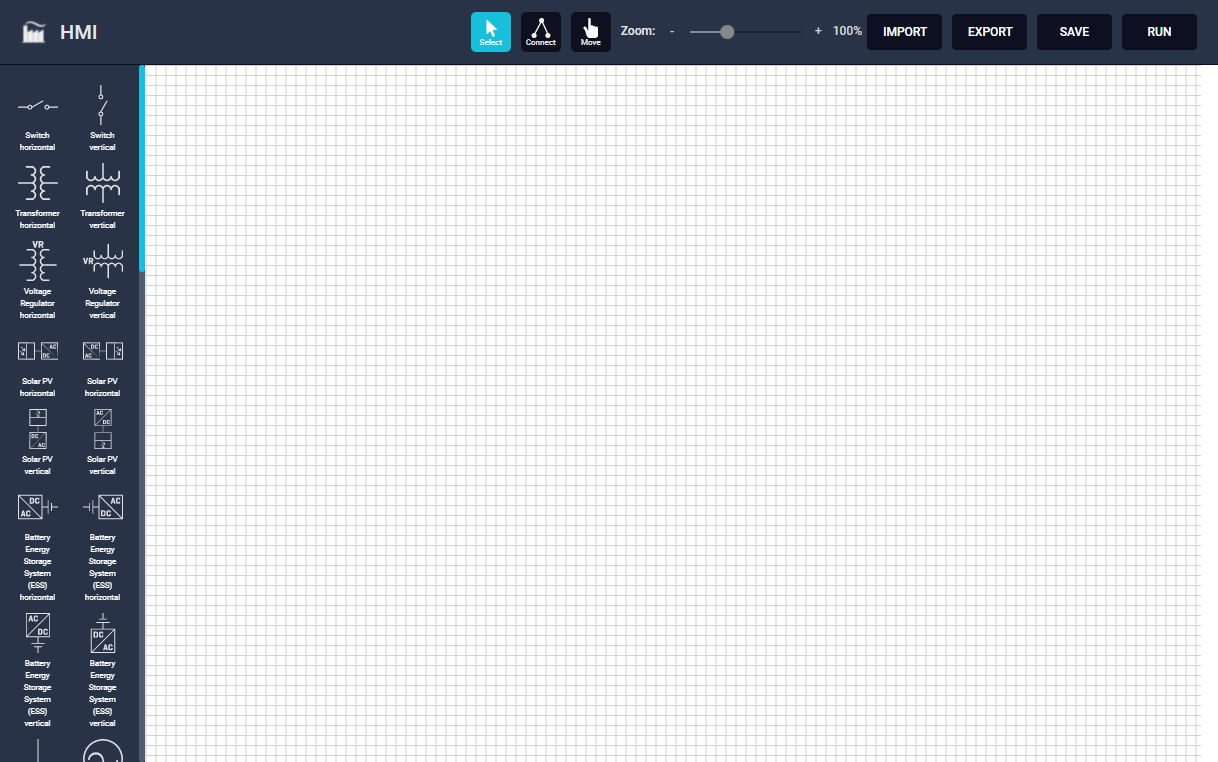
Drag and drop symbols (on left panel) onto the canvas. We need:
- An Uncontrollable Load symbol (for build load)
- A Solar Panel symbol
- A Battery Energy Storage System (ESS) symbol
- A Breaker(or Switch) symbol
- A Feeder symbol to represent distribution grid (for completeness)
- An Uncontrollable Load symbol (for build load)
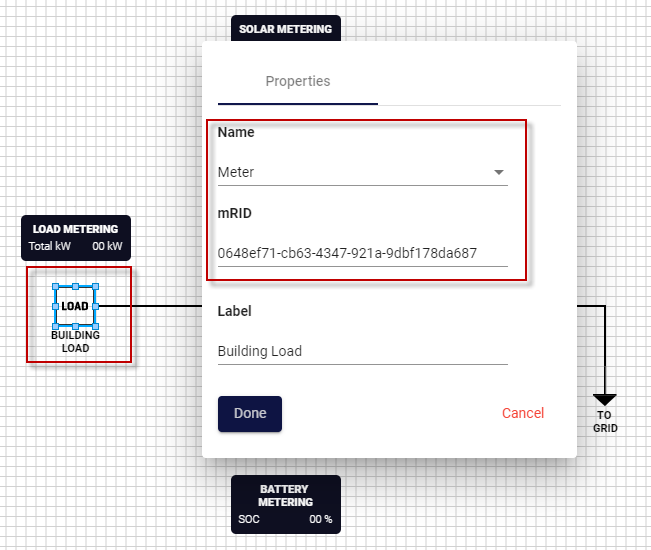
For identification purposes, assign each symbol on the canvas with its MRID.
- Double-click the symbol to bring up
Symbol Property Dialog. - On the dialog name drop down, select the appropriate device to assign to the symbol. Note that the MRID is automatically populated according to the selection.
- On label text box, enter label text to be displayed on the diagram (optional).
- Double-click the symbol to bring up
To connect the symbols, select the "Connect" menu on the top panel. For each symbol you want to connect:
- hover your mouse over the symbol connection port (the connection port is highlighted in green when hovered over)
- click and drag to the other symbol connection port
At this point, you have a basic single-line diagram that represents the microgrid. To make it useful, you need measurement displays to monitor readings and/or status from the equipment. You need to add three
measurement boxesto the canvas: one for each building load, solar, and battery.- Drag
measurement boxto canvas. - Select name.
- Enter label text.
- Drag
For the three measurement boxes, tell the system what data item to display on the box, or in this tool's terminology,
Data Connection.- Double-click on the measurement box to bring up
Symbol Property Dialog - Click on "Data Connection" to go to "Data Connection" screen
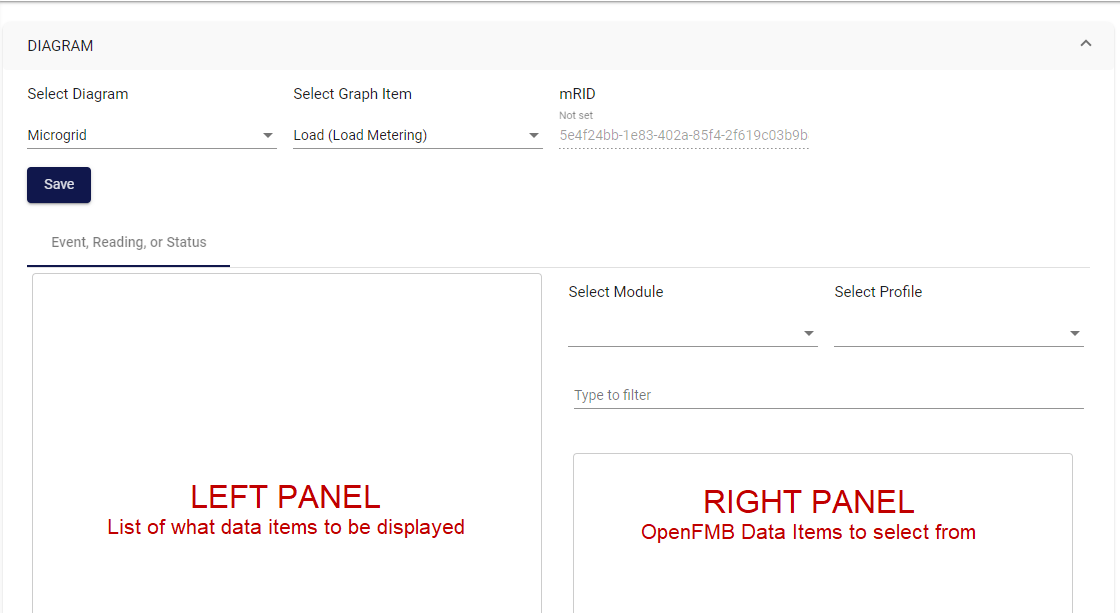
- For data connection and mapping, the screen has two main panels:
- The left panel features a list of items to be displayed on measurement box
- On the right panel, navigate through OpenFMB modules, profiles, and select data items to add to the left panel.
- For the building load, monitor the total power consumption (Total kW):
- On right panel, select
loadmodulemodule, the selectLoadReadingProfile. - Filter or navigate to
readingMMXU.W.net.cVal.magand click+button to add to left panel.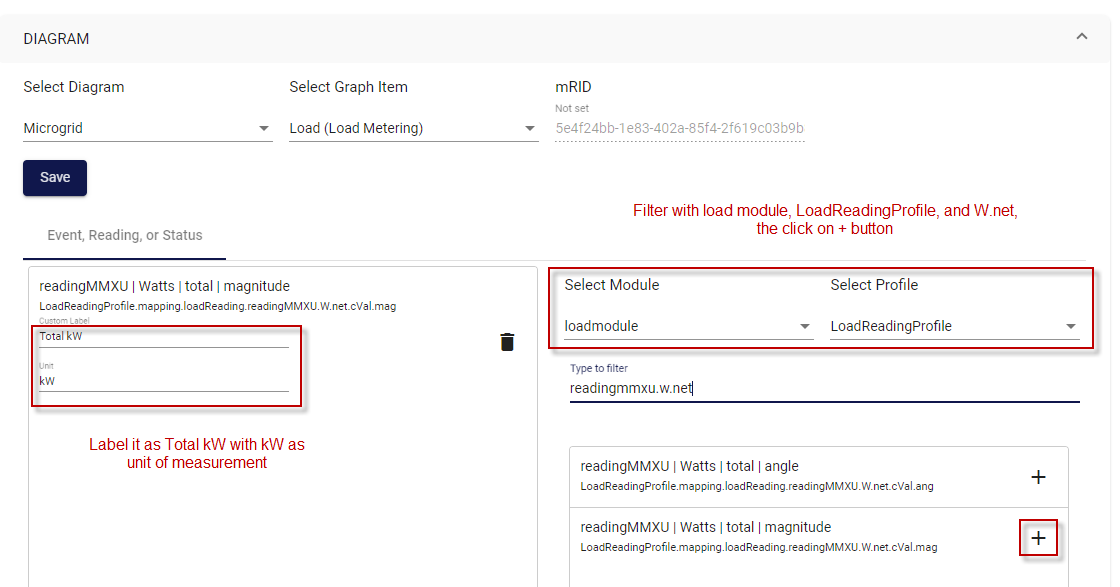
- On right panel, select
- For the solar, monitor the total power production (Total kW):
- On right panel, select
solarmodulemodule, the selectSolarReadingProfile. - Filter or navigate to
readingMMXU.W.net.cVal.magand click+button to add to left panel.
- On right panel, select
- For the battery, monitor the current State of Charge (SOC %):
- On right panel, select
essmodulemodule, the selectESSStatusProfile. - Filter or navigate to
essStatus.essStatusZBAT.Soc.magand click+button to add to left panel.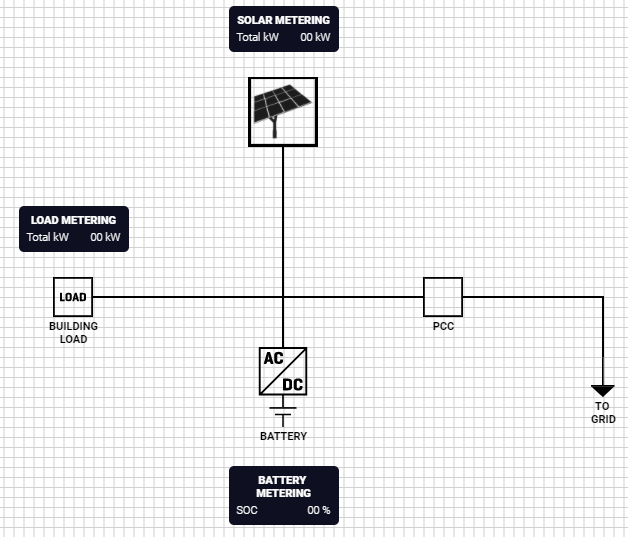
- On right panel, select
- Double-click on the measurement box to bring up
You now have the measurement boxes for monitoring reading and status. Next, add a
Data Connectionon the Switch (PCC) so that it shows correct position (Open/Close) and allows trip/close operations- Double-click on the switch/breaker symbol to bring up
Symbol Property Dialog - Click on "Data Connection" to go to "Data Connection" screen
- To map the switch position:
- Select
Event, Reading, or Statustab on the left panel - On right panel, select
switchmodule, and then selectSwitchStatusProfile - Filter or navigate to
switchStatus.statusAndEventXCBR.Pos.phs3.stValand click+button to add to the left panel
- Select
- To map the switch control for trip/close operations:
- Select
Controltab on left panel - On right panel, select
switchmodulemodule, and then selectSwitchDiscreteControlProfile - Filter or navigate to
switchDisc...eControlXCBR.discreteControlXCBR.Pos.phs3.ctlValand click+button to add to the left panel
- Select
- Double-click on the switch/breaker symbol to bring up


Run the Diagram
Click the RUN button on the top right corner to put the diagram in run mode.